Performs clustering of spatial data using a combination of spatial Principal Component Analysis (PCA), and fuzzy k-means clustering.
The workflow consists of:
Dimensionality reduction using spatial PCA
Selection of components based on explained spatial variance
Fuzzy clustering over selected components
Usage
kmspc(
  data,
  variables,
  number_cluster = 3:5,
  explainedVariance = 70,
  ldist = 0,
  udist = 40,
  center = TRUE,
  fuzzyness = 1.2,
  distance = "euclidean",
  zero.policy = FALSE,
  only_spca_results = TRUE,
  all_results = FALSE
)
Arguments
- data
an
sfobject with point geometries- variables
charactervector with variable names used for clustering. If missing, all numeric variables indataare used.- number_cluster
numericvector indicating the number of clusters to evaluate (e.g.,3:5)- explainedVariance
numeric. Percentage (0–100) of cumulative explained spatial variance used to select spatial principal components. Values between 0 and 1 are interpreted as proportions.- ldist, udist
numeric. Lower and upper distance thresholds used to define spatial neighbors.- center
centering option passed to PCA:
- TRUE
center variables by their mean
- FALSE
no centering
- numeric
custom centering vector
- fuzzyness
numericvalue greater than 1 controlling the degree of fuzziness in clustering (seee1071::cmeans)- distance
characterdistance metric for clustering. One of"euclidean"or"manhattan"(abbreviations allowed)- zero.policy
Logical. If
TRUE, allows empty neighbor sets; ifFALSE, stops with an error.- only_spca_results
logical. IfTRUE, only spatial PCA results are returned. IfFALSE, both PCA and spatial PCA summaries are included.- all_results
logical. IfTRUE, full PCA and spatial PCA objects are returned (can increase computation time and memory use).
Value
A list with the following elements:
- cluster
data.framewith cluster assignments for each evaluated number of clusters- indices
data.framewith clustering validity indices- summaryResults
data.framewith clustering metrics (iterations, SSDW)- pca_results
(optional) PCA and/or spatial PCA summaries depending on arguments
Details
Spatial relationships are defined using distance-based neighbors
(spdep::dnearneigh). These relationships are incorporated into the
spatial PCA analysis to extract spatially structured components.
Clustering is performed using fuzzy c-means over selected spatial components. Several indices are computed to help determine the optimal number of clusters:
Xie-Beni index
Partition coefficient
Partition entropy
Summary index (normalized combination)
Examples
library(sf)
data(wheat, package = 'paar')
# Transform the data.frame into a sf object
wheat_sf <- st_as_sf(wheat, coords = c('x', 'y'), crs = 32720)
# Run the kmspc function
kmspc_results <- kmspc(wheat_sf, number_cluster = 2:4)
#> Warning: All numeric Variables will be used to make clusters
# Print the summaryResults
kmspc_results$summaryResults
#> Clusters Iterations SSDW
#> 1 2 18 1.8713082
#> 2 3 56 1.3057409
#> 3 4 23 0.9948927
# Print the indices
kmspc_results$indices
#> Num. Cluster Xie Beni Partition Coefficient Entropy of Partition
#> 1 2 3.520996e-05 0.9611975 0.06490128
#> 2 3 5.479347e-05 0.9391130 0.10430426
#> 3 4 5.827060e-05 0.9293032 0.12351250
#> Summary Index
#> 1 1.281105
#> 2 1.597481
#> 3 1.713107
# Print the cluster
head(kmspc_results$cluster, 5)
#> Cluster_2 Cluster_3 Cluster_4
#> [1,] "1" "3" "2"
#> [2,] "1" "3" "2"
#> [3,] "1" "3" "2"
#> [4,] "1" "2" "2"
#> [5,] "1" "2" "2"
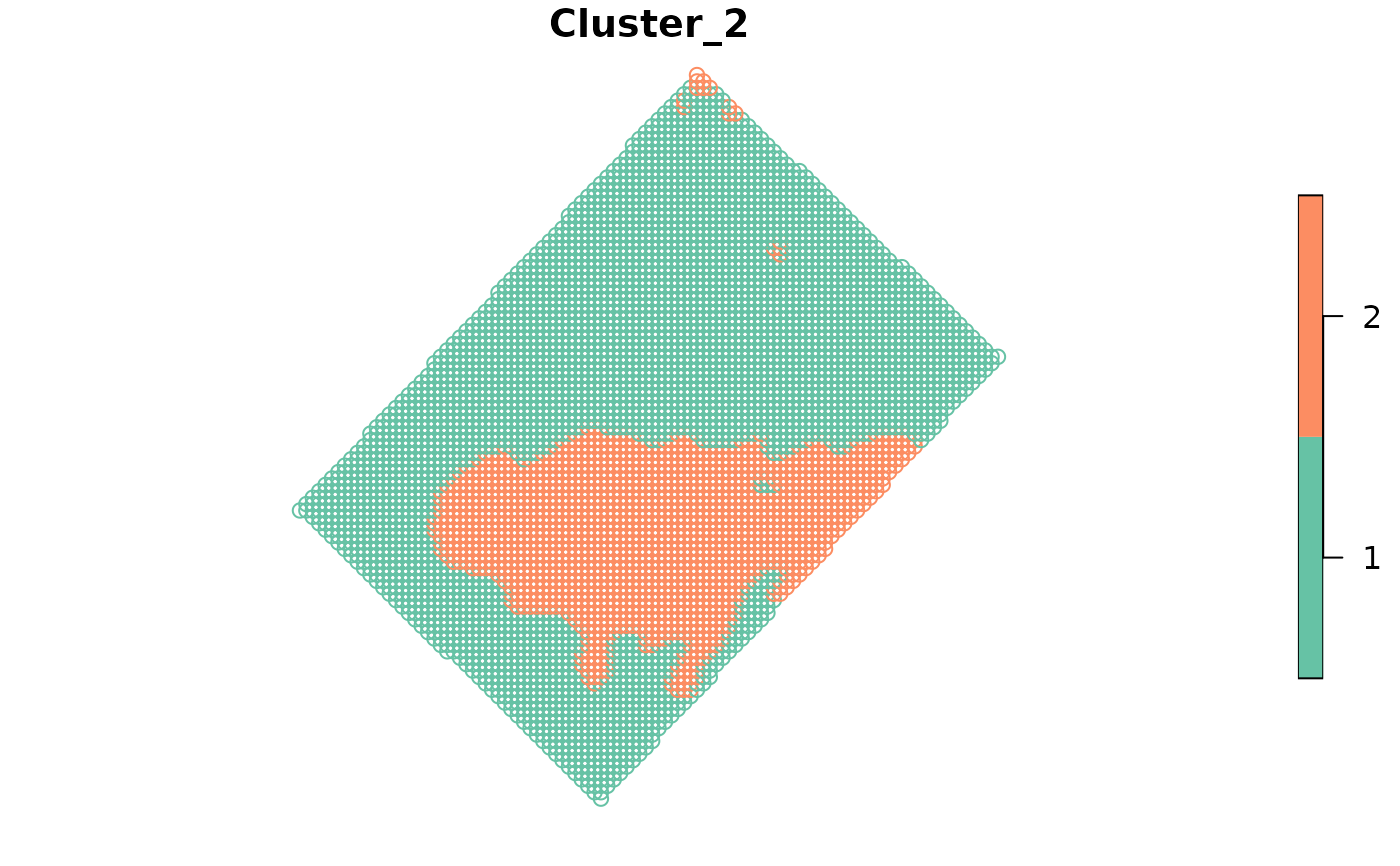
# Combine the results in a single object
wheat_clustered <- cbind(wheat_sf, kmspc_results$cluster)
# Plot the results
plot(wheat_clustered[, "Cluster_2"])