Performs fuzzy k-means clustering on tabular data (non-spatial).
This function is a lightweight wrapper around e1071::cmeans,
providing a vectorized workflow and clustering quality indices.
It is primarily intended as a fallback method when spatial clustering
(e.g., kmspc) cannot be applied, such as when only one variable
is available.
Usage
fuzzy_k_means(
  data,
  variables,
  number_cluster = 3:5,
  fuzzyness = 1.2,
  distance = "euclidean"
)
Arguments
- data
an
sfobject with point geometries- variables
charactervector with variable names used for clustering. If missing, all numeric variables indataare used.- number_cluster
numericvector indicating the number of clusters to evaluate (e.g.,3:5)- fuzzyness
numericvalue greater than 1 controlling the degree of fuzziness in clustering (seee1071::cmeans)- distance
characterdistance metric for clustering. One of"euclidean"or"manhattan"(abbreviations allowed)
Value
A list with:
- cluster
data.framewith cluster assignments for each evaluated number of clusters- indices
data.framewith clustering validity indices- summaryResults
data.framewith clustering metrics
Details
Missing values are removed prior to clustering. Observations with missing
values are reintroduced in the output with NA cluster assignments.
Clustering is performed for each value in number_cluster, and
several indices are returned to assist in selecting the optimal number
of clusters:
Xie-Beni index
Partition coefficient
Partition entropy
Summary index
Examples
library(sf)
data(wheat, package = 'paar')
# Transform the data.frame into a sf object
wheat_sf <- st_as_sf(wheat, coords = c('x', 'y'), crs = 32720)
# Run the fuzzy_k_means function
fuzzy_k_means_results <- fuzzy_k_means(
wheat_sf,
variables = 'Tg',
number_cluster = 2:4
)
# Print the summaryResults
fuzzy_k_means_results$summaryResults
#> Clusters Iterations SSDW
#> 1 2 20 0.020516877
#> 2 3 43 0.010596950
#> 3 4 34 0.006439882
# Print the indices
fuzzy_k_means_results$indices
#> Num. Cluster Xie Beni Partition Coefficient Entropy of Partition
#> 1 2 2.340529e-05 0.9709446 0.04784131
#> 2 3 2.407361e-05 0.9603949 0.06536385
#> 3 4 2.348571e-05 0.9582419 0.06906399
#> Summary Index
#> 1 1.557271
#> 2 1.695319
#> 3 1.710485
# Print the cluster
head(fuzzy_k_means_results$cluster, 5)
#> Cluster_2 Cluster_3 Cluster_4
#> [1,] "2" "2" "2"
#> [2,] "2" "2" "2"
#> [3,] "2" "2" "2"
#> [4,] "2" "2" "2"
#> [5,] "2" "2" "2"
# Combine the results in a single object
wheat_clustered <- cbind(wheat_sf, fuzzy_k_means_results$cluster)
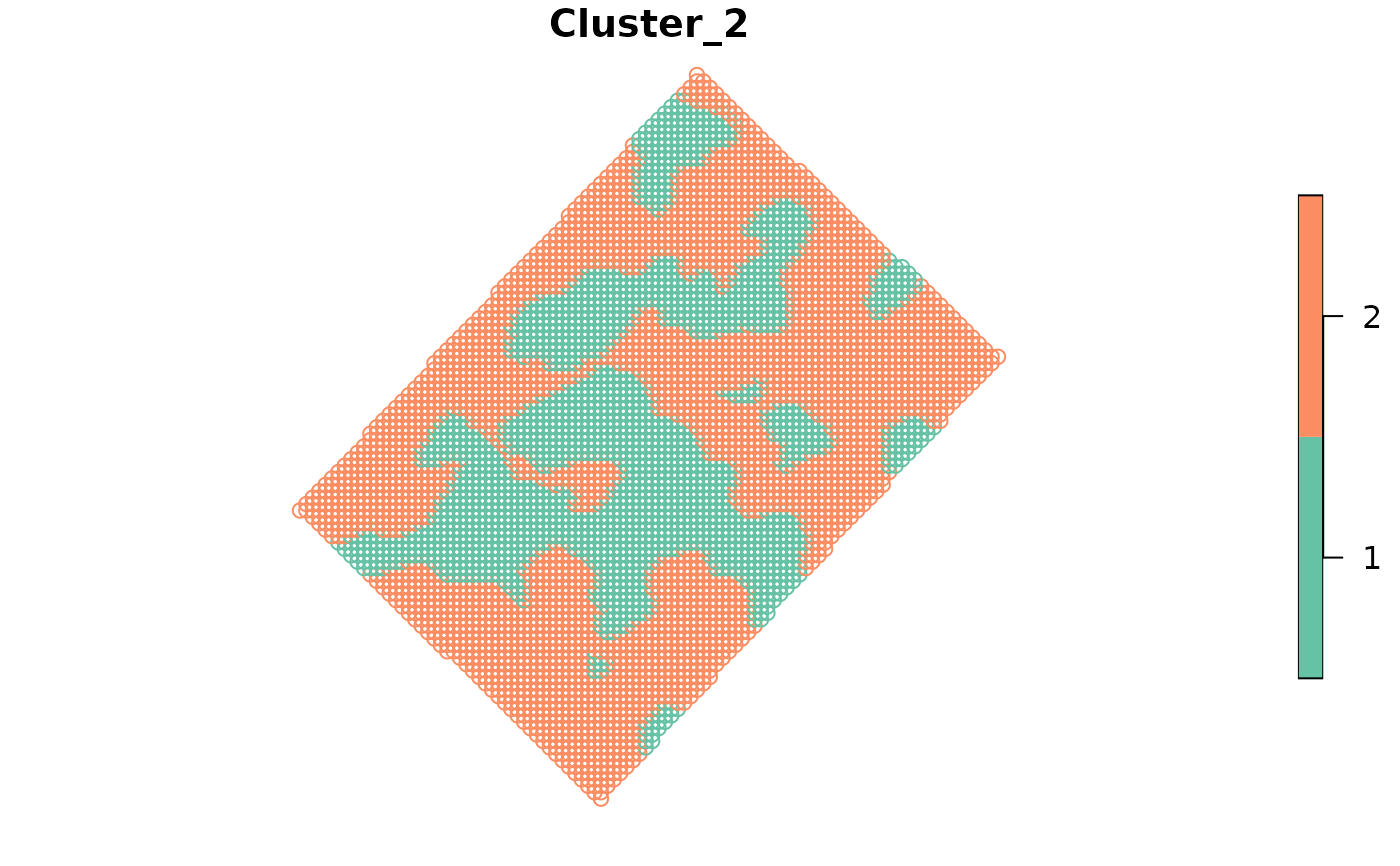
# Plot the results
plot(wheat_clustered[, "Cluster_2"])